Details
-
Suggestion
-
Status: New
-
Resolution: Unresolved
-
Xray DC 8.4.6
-
None
-
None
-
Standard
-
Description
Description
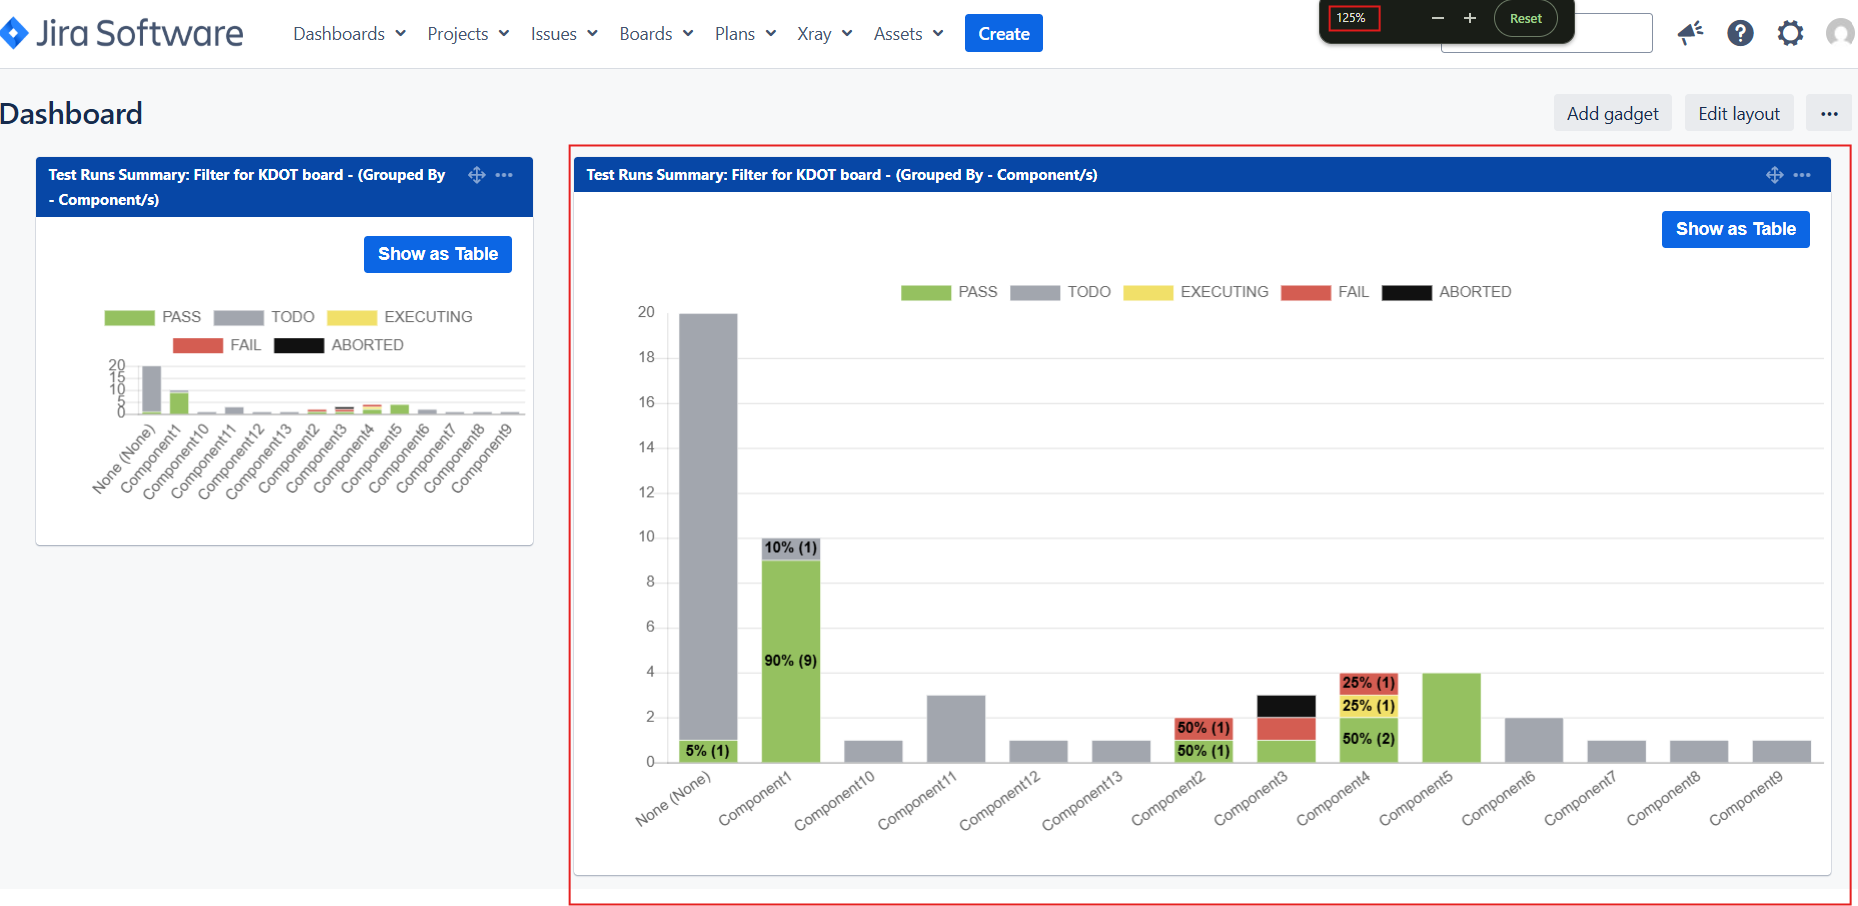
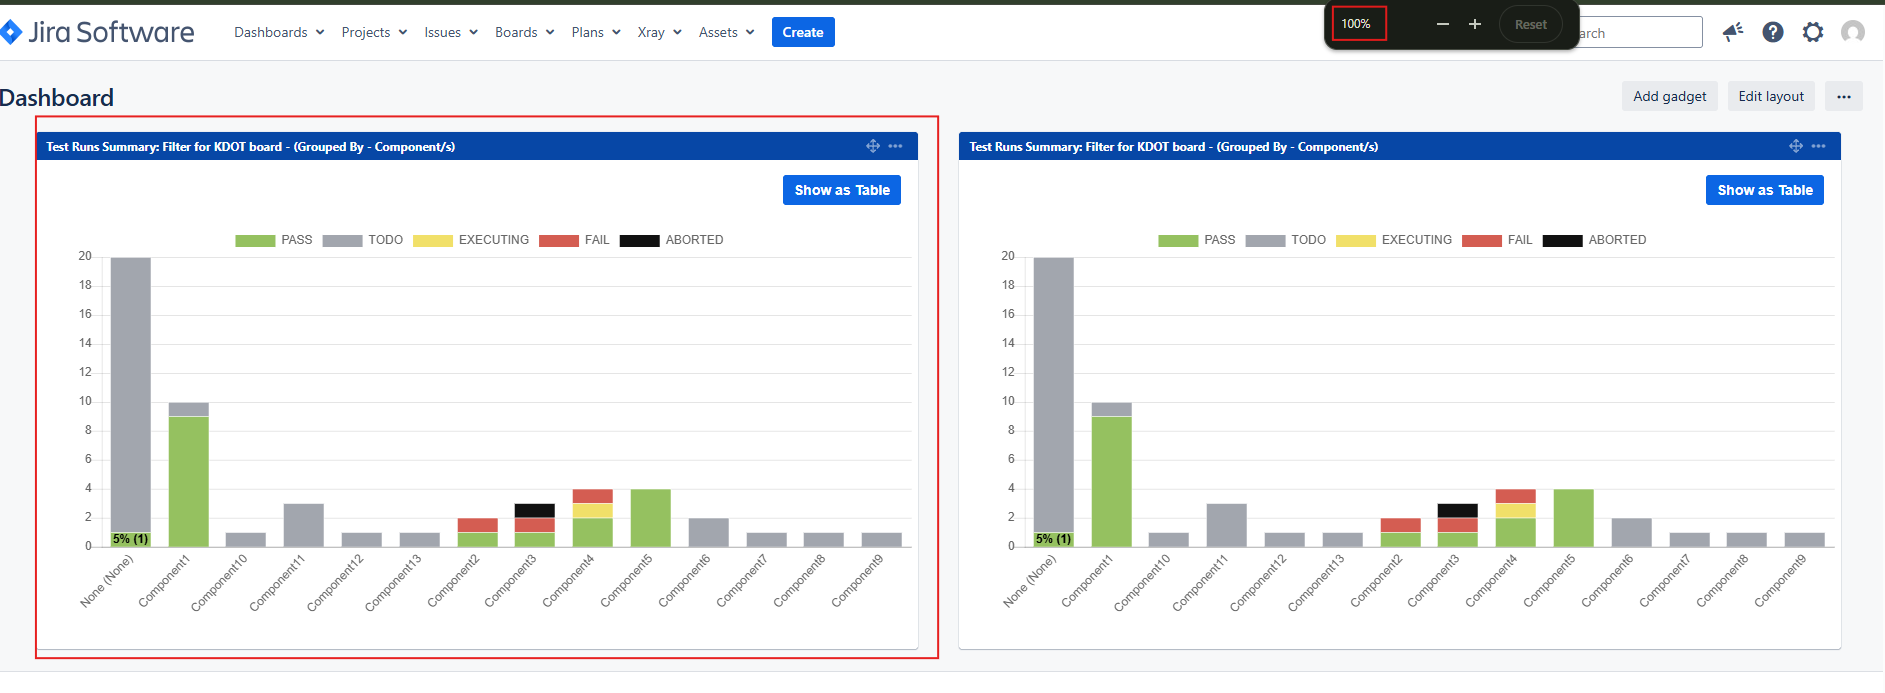
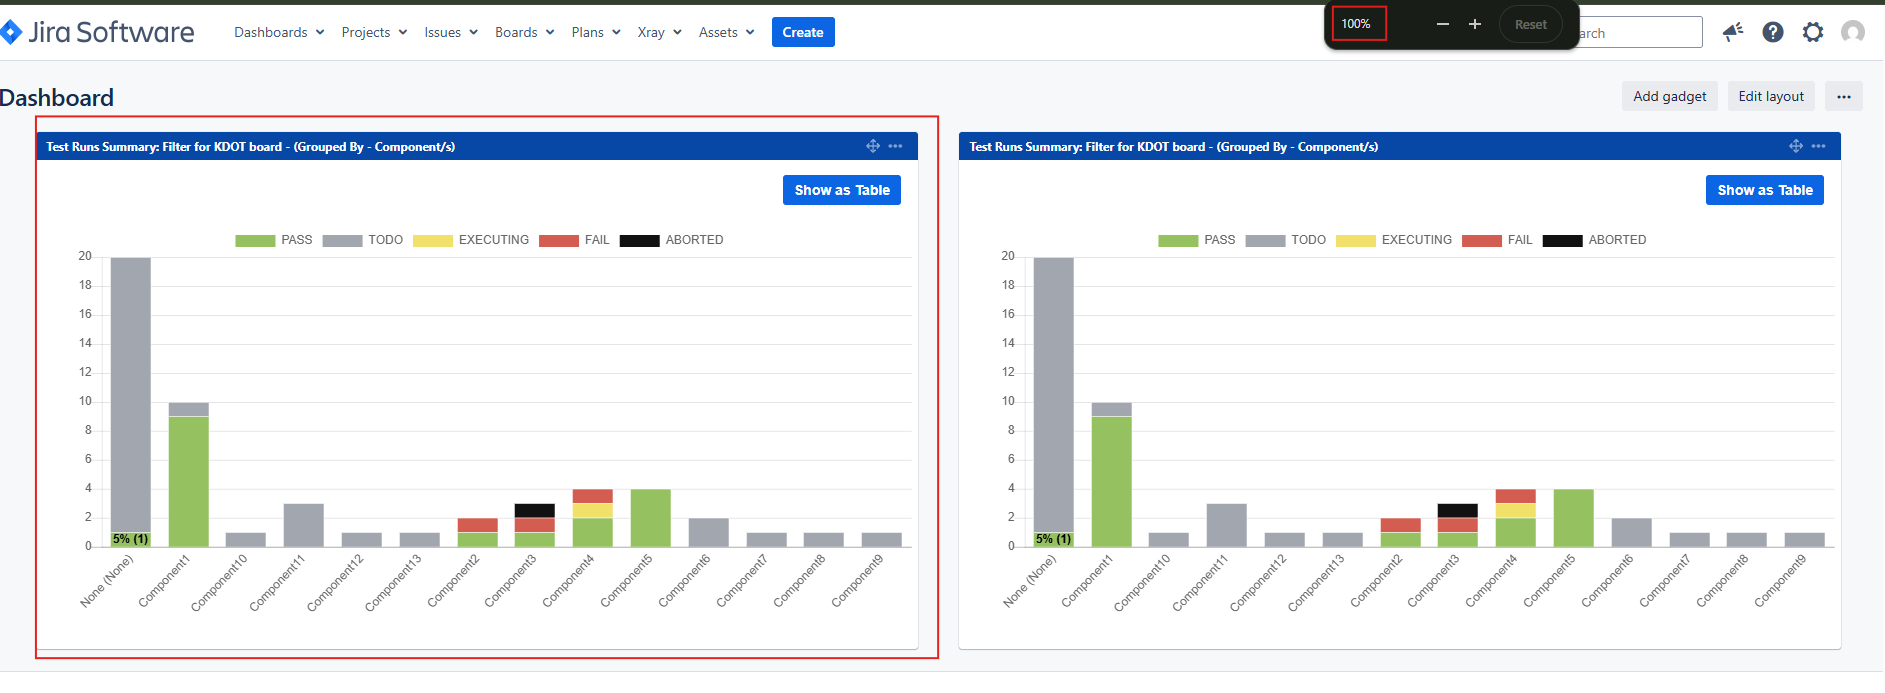
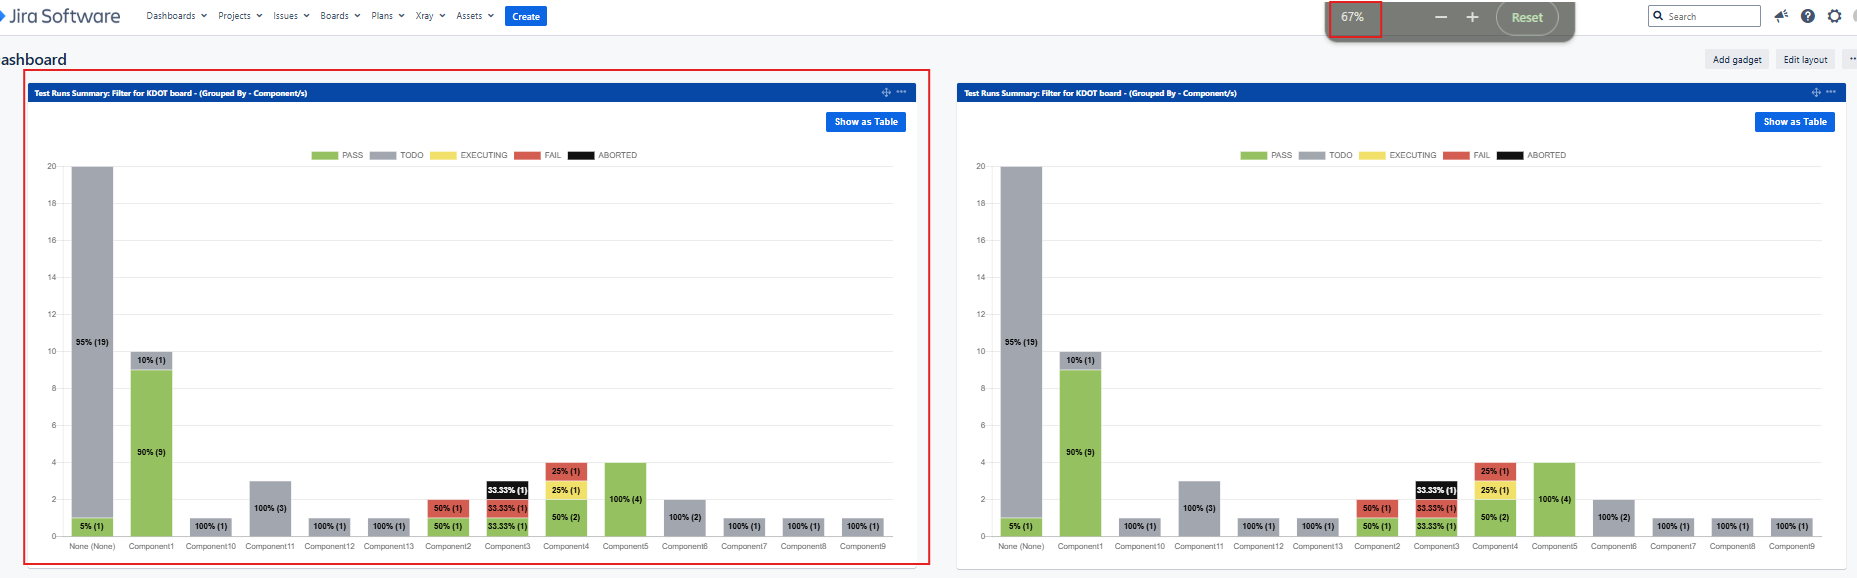
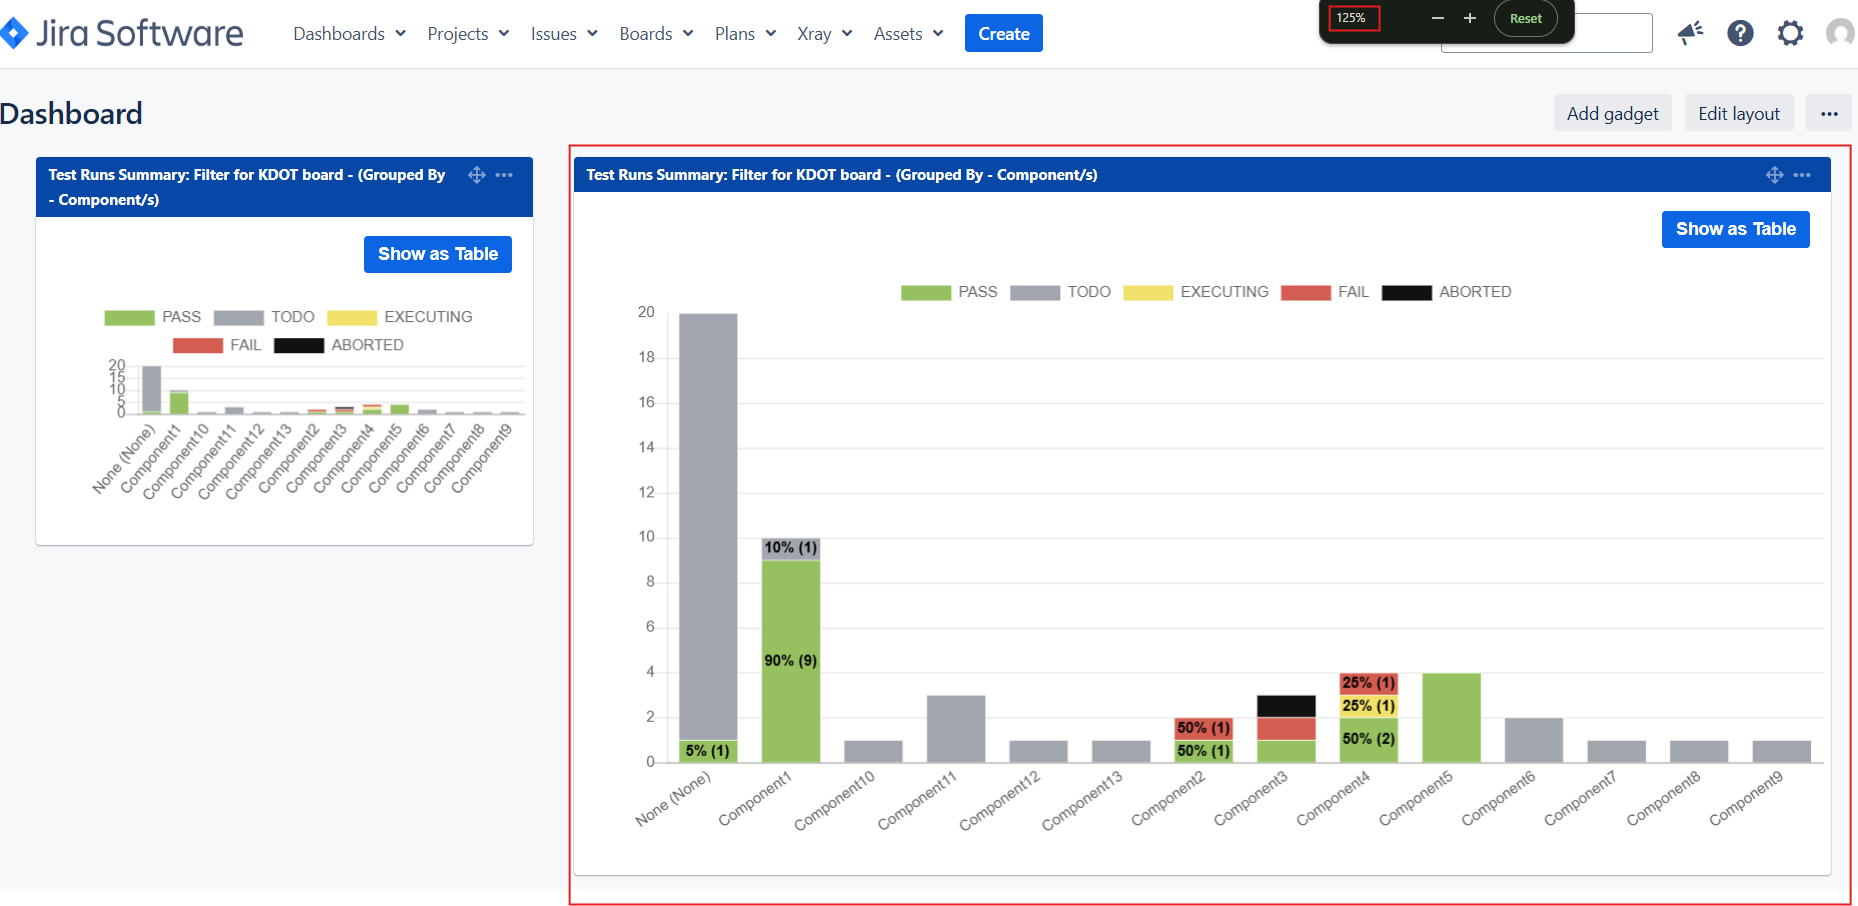
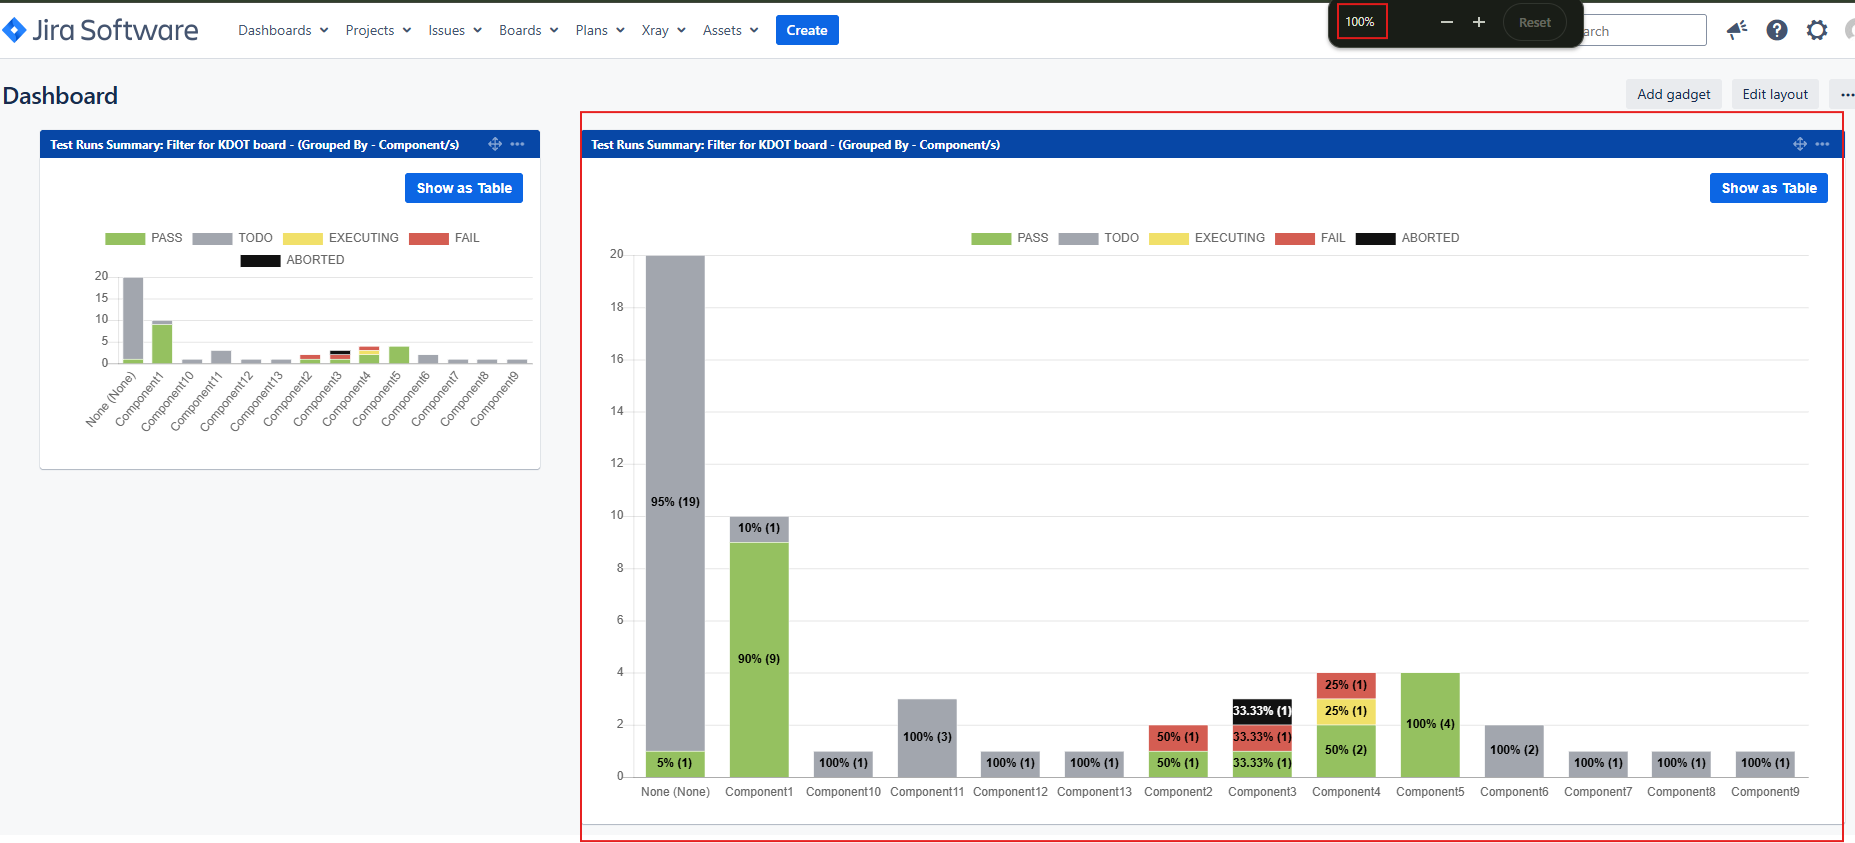
The percentage values in the Test Runs Summary gadget are not always shown when grouping the results by Components.
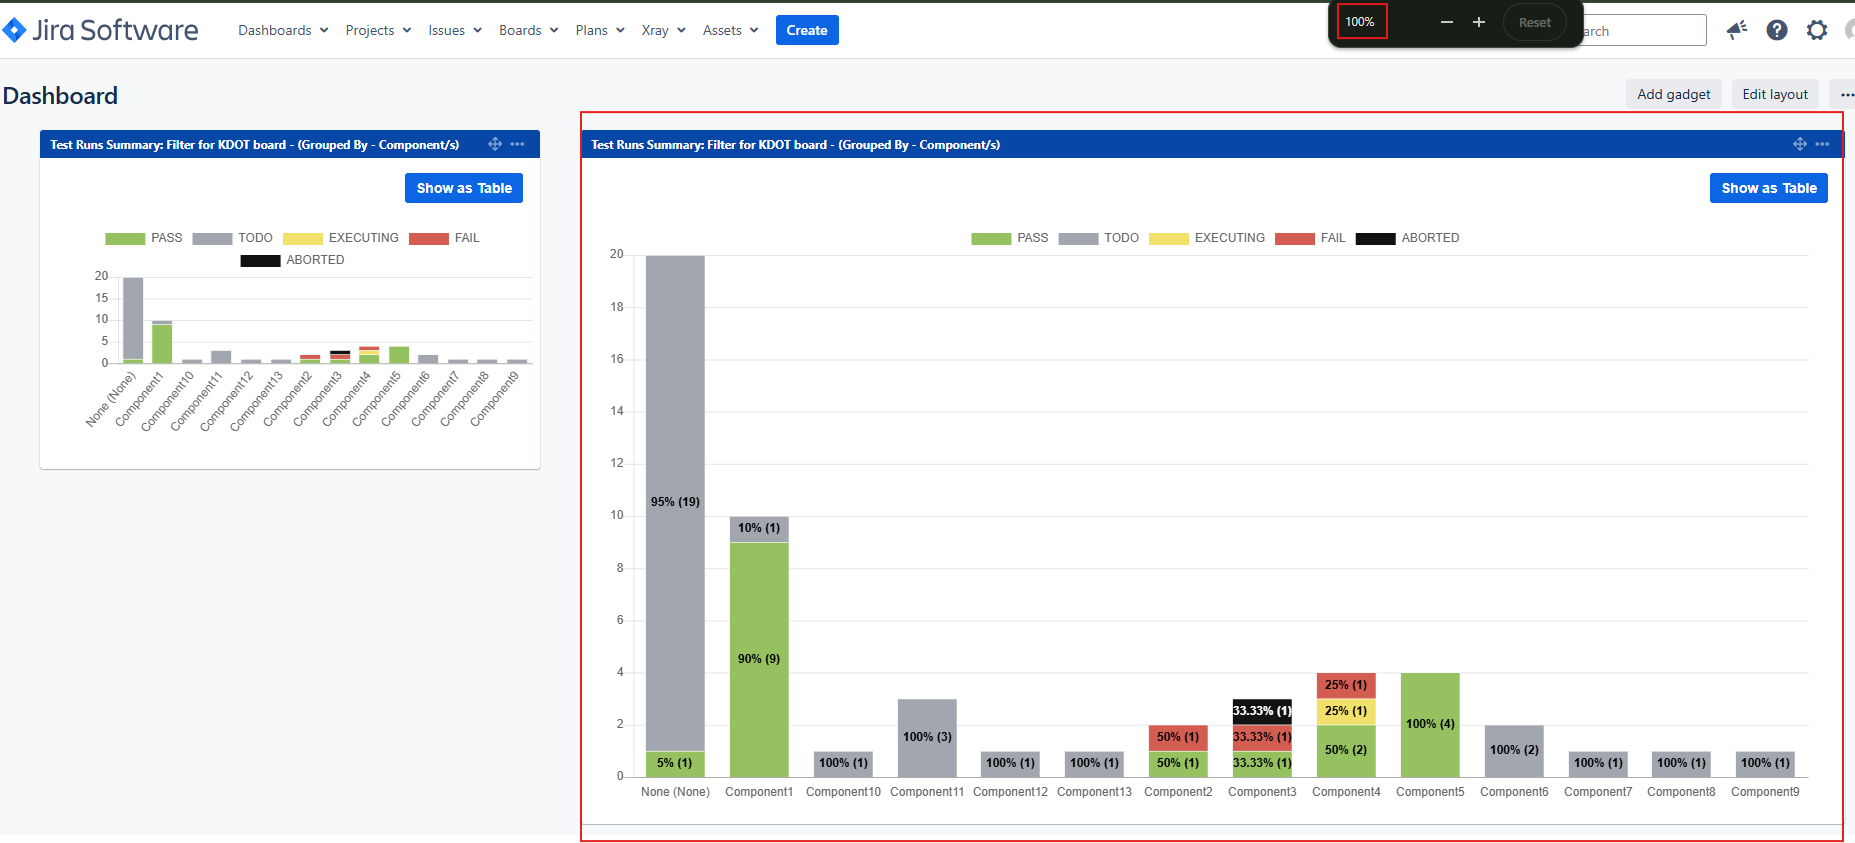
When the gadget is displayed in a smaller column or section, some percentage values are not shown directly.
The percentage values should remain visible regardless of the selected dashboard layout.
User friction
Users cannot immediately view all percentage values when the gadget is placed in a smaller layout.
Steps to reproduce:
- Create or open a Jira dashboard
- Add the Test Runs Summary gadget
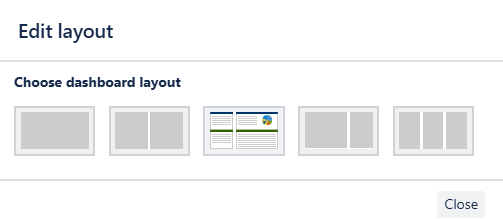
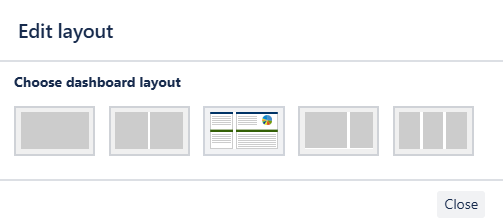
- Use a dashboard layout that reduces the available width.
- View the gadget - not all percentages are shown
Actual Result:
IMPACT
What would improve if solved:
All percentage values would remain accessible and easy to read regardless of the dashboard layout or browser zoom level.
Impact on stakeholders:
Users would be able to review Test Runs Summary gadget more quickly and consistently.
Current workaround:
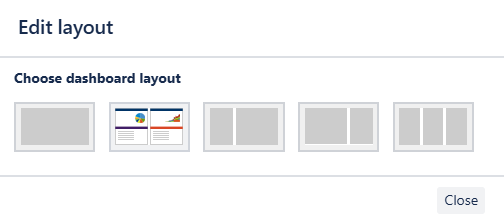
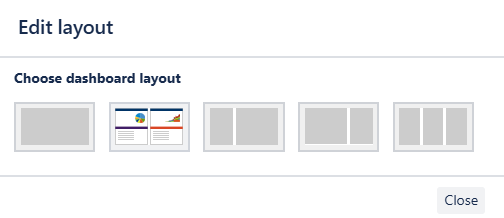
- Use the first dashboard layout, which uses the full width of the screen.
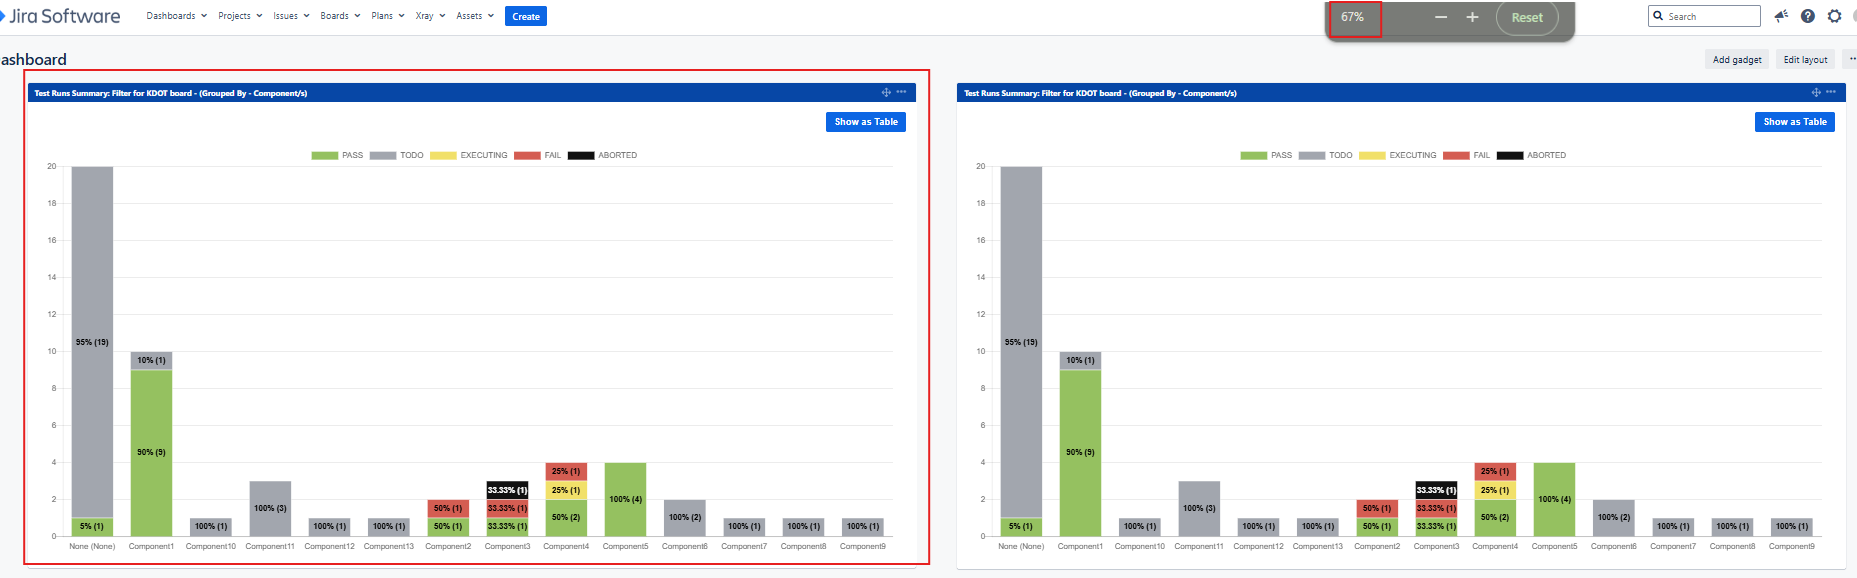
- Zooming out in the browser
- Hovering each bar to view its percentage value
CONTEXT & EXAMPLES:
Concrete example:
This issue is more noticeable when there are more components.
When the gadget is displayed in a wide dashboard column, the percentage values are shown on most or all chart columns.
Workaround risk:
Although zooming out allows users to see more columns and percentage values, it is not practical for regular use because it reduces the size and readability of the entire dashboard.
Hovering over each column displays the percentage, but this requires users to check the values individually and does not allow them to view all percentages at a glance. Therefore, these options serve as temporary workarounds rather than a suitable long-term solution.