Details
-
Bug
-
Status: Closed
-
Major
-
Resolution: Done
-
R3.3.0, R3.3.1
-
None
-
None
Description
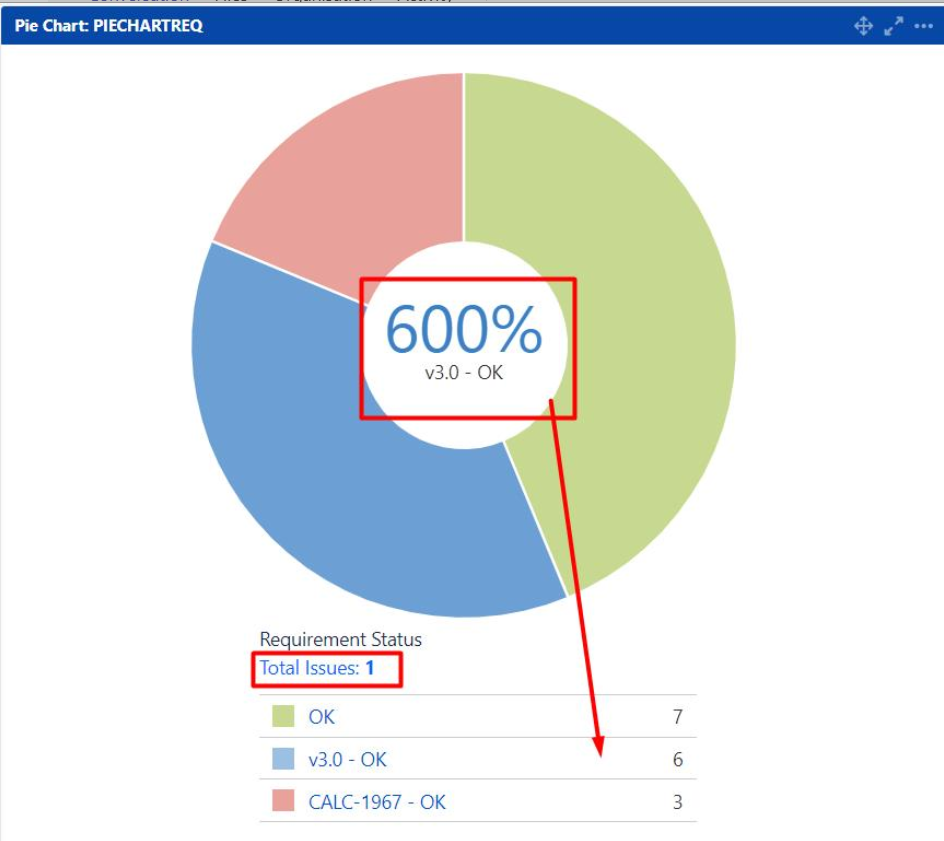
The 'Pie Chart' doesn't shows the distribution between the different requirement statuses in a consistent way, leading to results where the same requirement appears multiple times, which in turn will exceed the 100% that the pie should represent.
This occurs because the "Requirement Status" custom field can be configured in several different ways (e.g. it may show the calculated status for all assigned versions).
In sum, the 'Pie Chart' currently does not support all configurations of Xray for the custom field "Requirement Status".
In order to provide consistent results, whenever using the "Requirement Status" in statistical based gadgets (e.g. Pie Chart, Two Dimensional Filter Statistics) it should provide one value only for a requirement, independent of the configuration for the custom field.
This bugfix will make sure, Xray calculates and presents values for "No Version" (i.e. taking into account the latest execution results).
As a consequence, the behaviour will change from previous versions (e.g. <= 3.1.x), as this behaviour will implement a consistent way of showing results.
Example of actual result showcasing the problem:
