Details
-
Suggestion
-
Status: In Progress
-
Resolution: Unresolved
-
None
-
-
64
Description
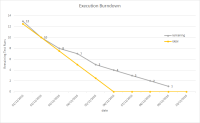
Xray must provide a burn down chart for Test Executions and Test Plans related Test Runs.
Aim: This report will provide a trend report so that the test manager can see if the test execution speed is correct towards achieving the final goal.
- one line should show how many test runs were executed (final status) at a given point in time.
- an ideal linear trend line should be present; it should take into account the TE or TP planned date range (begin/end dates) and the amount of Test Runs
Flag: exclude non-working days (checked by default)
Filters:
- test execution or test plan
- test run's assignee, status, priority, component
- test type
- test environment (only if test plan is chosen)
Date range: obtained from Test Execution or Test Plan, begin/end dates
Chart Title: by default "Execution Burndown" but may be customized
Note: this report does not take into account the estimated execution effort for each Test.
Attachments
Issue Links
- is cloned by
-
XRAYCLOUD-5071 As a user, I can see a burn down chart for a Test, a Test Execution or a Test Plan
- New
- mentioned in
-
Page Loading...


