Details
-
Story
-
Status: Closed
-
Major
-
Resolution: Done
-
None
Description
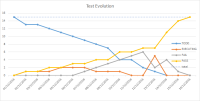
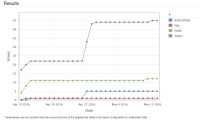
A new JIRA gadget "Tests evolution" should provide a chart for showing the evolution of the status of the Tests, with a line for each status.
A special dotted line should be present, consisting of the number of total tests.
Aim: see the evolution/progress (accumulated status) of the tests, namely the ones belong to a Test Plan.
xx: date
yy: number of tests (not test runs)
Time period for xx axis: day, week, month
Date range:
- custom (start+end date), time range
- if "time range", then one of the following ones:
- current week
- last week
- current month
- last month
Show as table: flag (disable by default) for showing the results in a table view
Filters:
- saved filter (for finding Test Executions)
- saved filter (for finding Tests)
- test run's assignee, status
- test environment
Chart Title: by default "Tests Evolution" but may be customized
Attachments
Issue Links
- mentioned in
-
Page Loading...


